
To measure new homeowner direct mail results, connect responses to qualified leads, new customers, revenue, and campaign costs. Use consistent denominators and a defined reporting window. Track contribution as well as sales, and separate matched purchases from proven incremental results. Response rate alone cannot show whether a campaign created profitable new business.
For agency account managers and business owners, the important question is not simply whether people responded. It is whether the campaign attracted suitable customers at a commercially viable cost. A useful report follows each stage, from initial response to contribution, while making clear what the available evidence can and cannot prove.
Why is response rate only the beginning?
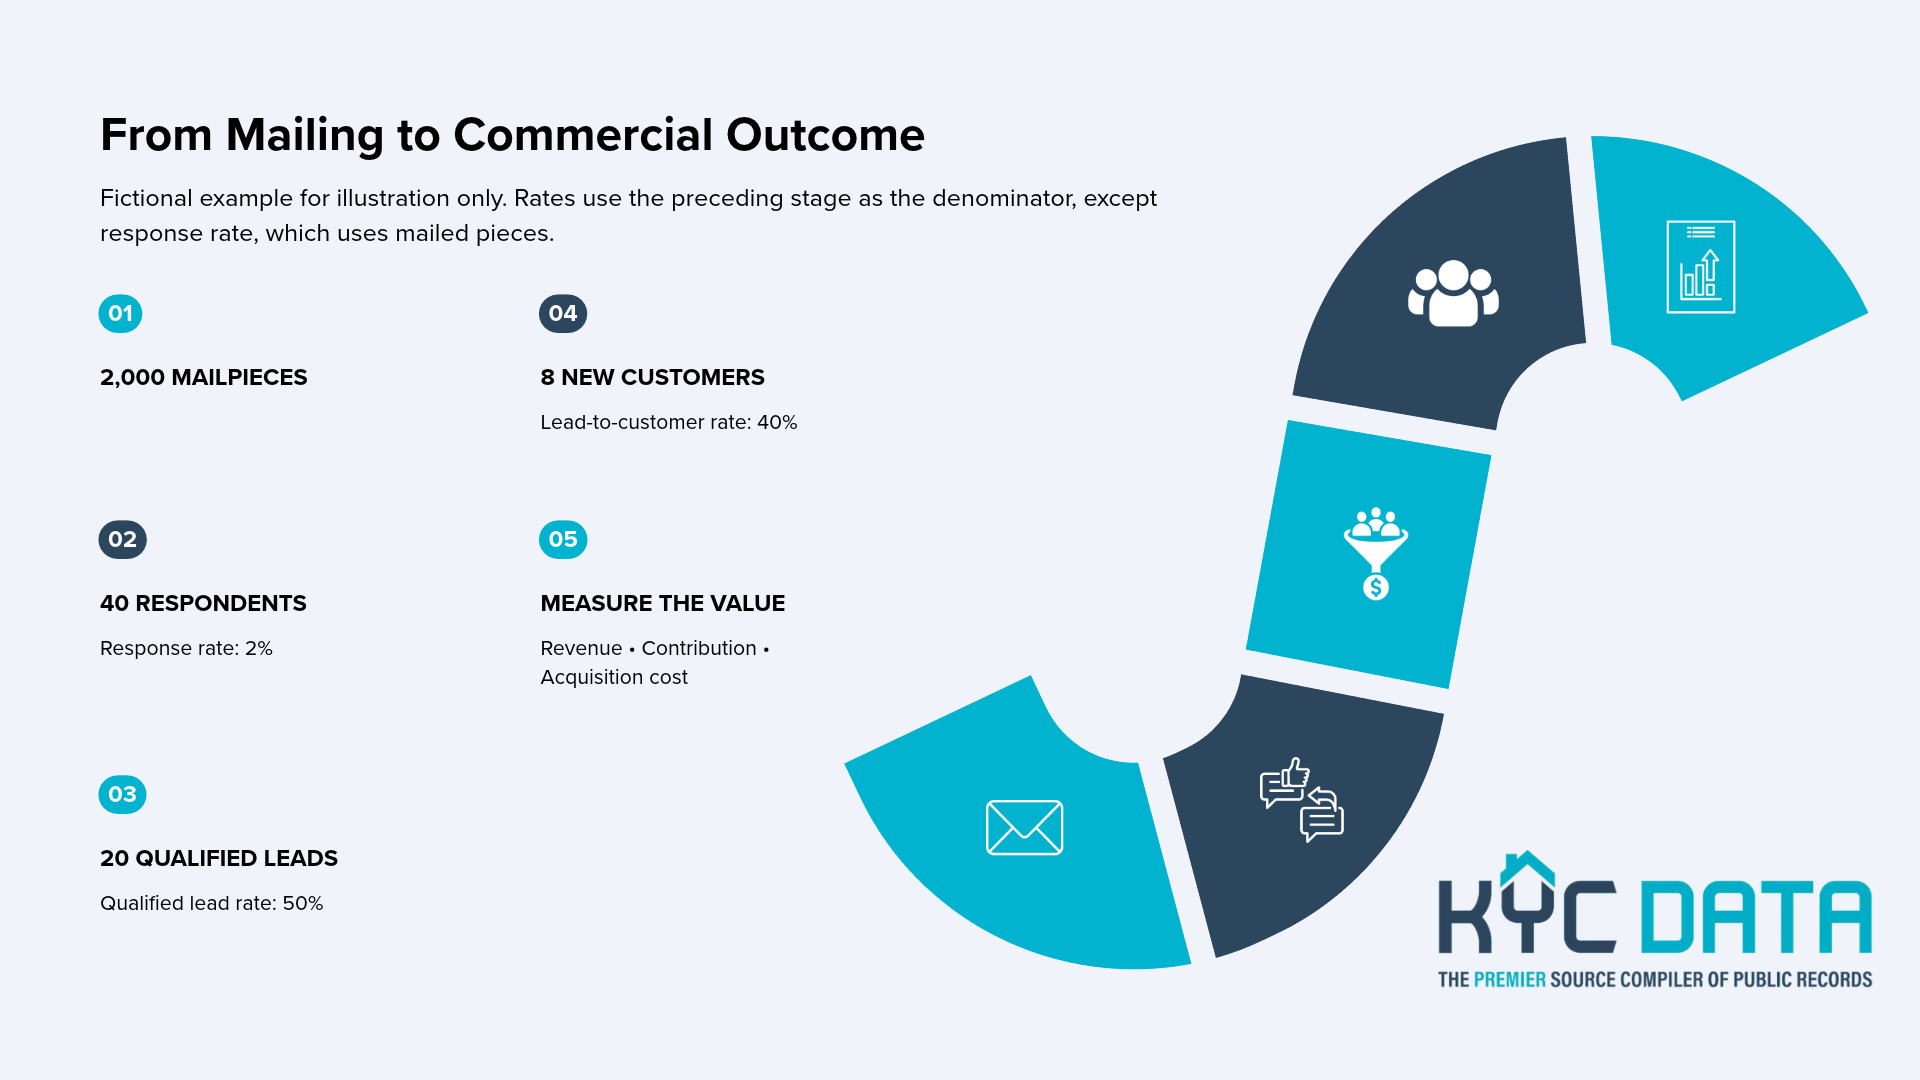
Response rate is the number of unique respondents divided by the number of mailed pieces, expressed as a percentage. If 40 people respond to 2,000 pieces, the response rate is 2%.
However, a response is not necessarily a qualified lead or a sale. Someone might scan a QR code, visit a landing page, request information, or submit an enquiry without becoming a customer. Report these actions separately.
For a campaign involving repeat mailings, also record unique households where possible. The number of pieces can exceed the number of households reached because one household may receive several touches. This matters when comparing new homeowner data campaigns with different mailing schedules.
Response rate is a useful starting point, but it cannot establish profitability. It needs to sit alongside the later stages of the customer journey.
Which lead and customer metrics matter?
Track the proportion of respondents who become qualified leads, the proportion of qualified leads who become customers, and the proportion of mailed pieces that produce customers. Define each stage before reporting results.
| Metric | Calculation |
|---|---|
| Qualified lead rate | Qualified leads ÷ unique respondents |
| Lead-to-customer rate | New customers ÷ qualified leads |
| Customer acquisition rate | New customers ÷ mailed pieces |
Define a qualified lead using criteria relevant to the business, such as service eligibility, genuine interest, and ability to proceed. Apply the same criteria across campaigns.
Deduplicate contacts consistently so repeated enquiries from one person do not inflate results. Use a defined reporting window and explain whether customers are counted by enquiry date, purchase date, or another agreed event.
These direct mail campaign metrics show where outcomes change. A strong response rate with few qualified leads may point to an offer or audience mismatch. Many qualified leads but few sales may indicate a sales-process issue, pricing concern, or longer buying cycle. The numbers identify questions to investigate, not automatic explanations.
How do you calculate acquisition cost and contribution?
Calculate direct mail acquisition cost by including the campaign costs you have chosen to measure, such as list costs, printing, postage, and campaign-specific creative or handling. State any exclusions clearly.
Consider this hypothetical example:
| Measure | Result |
|---|---|
| Mailed pieces | 2,000 |
| Total campaign cost | $2,400 |
| Respondents | 40 |
| Qualified leads | 20 |
| New customers | 8 |
| Revenue | $8,000 |
| Contribution before marketing | $3,200 |
The response rate is 40 ÷ 2,000 = 2%. Cost per qualified lead is $2,400 ÷ 20 = $120. Customer acquisition cost (CAC) is $2,400 ÷ 8 = $300.
If the $3,200 contribution already deducts variable fulfilment costs, subtracting the $2,400 campaign cost leaves $800 in net campaign contribution. This is not company net profit because other business costs may remain.
Direct mail ROI should reflect the return measure and cost basis used. Revenue divided by campaign cost is a revenue-to-cost ratio, not profit-based ROI. Keep the definitions visible so decision-makers can compare like with like.
How can you connect responses and purchases to mail?
Use trackable response paths and consistent customer records to connect activity with a campaign. A unique URL, QR destination, promotion code, or CRM campaign field can help identify responses linked to a specific mailing.
Direct mail matchback means comparing customer purchase records with the list of people or households mailed. This can identify purchases made by matched recipients, including purchases that happened through another channel. It does not prove that the mailing caused each purchase.
For reliable reporting, deduplicate records and agree how long after mailing a purchase can be counted. Record the reporting window, matching method, and any exclusions. Data hygiene supports consistent matching, but clean records alone cannot establish causation.
USPS guidance discusses response tracking and matchback as ways to connect mailings with outcomes, while noting that holdout comparisons can help assess the findings. Attribution remains dependent on the campaign design and available data.
What can a holdout reveal about incremental results?
A holdout can help estimate incremental direct mail sales by comparing outcomes for eligible people randomly assigned to receive mail with outcomes for a comparable group that does not receive it.
Measure purchases in both groups over the same period. Keep other marketing treatment as similar as possible, and record differences that could influence results. The purchase rate in the unmailed group provides a comparison for what may have happened without the mailing.
This is different from matchback. Matchback identifies purchases among mailed records. A holdout helps estimate whether mailing generated additional outcomes beyond those that might have occurred anyway.
Small groups, low purchase counts, overlapping audiences, and other marketing activity can make results uncertain. A holdout is not automatic proof of causation, particularly when the test design is weak. There is no universal lift benchmark that applies to every campaign. Explain the method and its limitations rather than presenting an estimate as a certainty.
What should a useful campaign report include?
A useful report brings the full journey into one view, with definitions and timeframes alongside the figures.
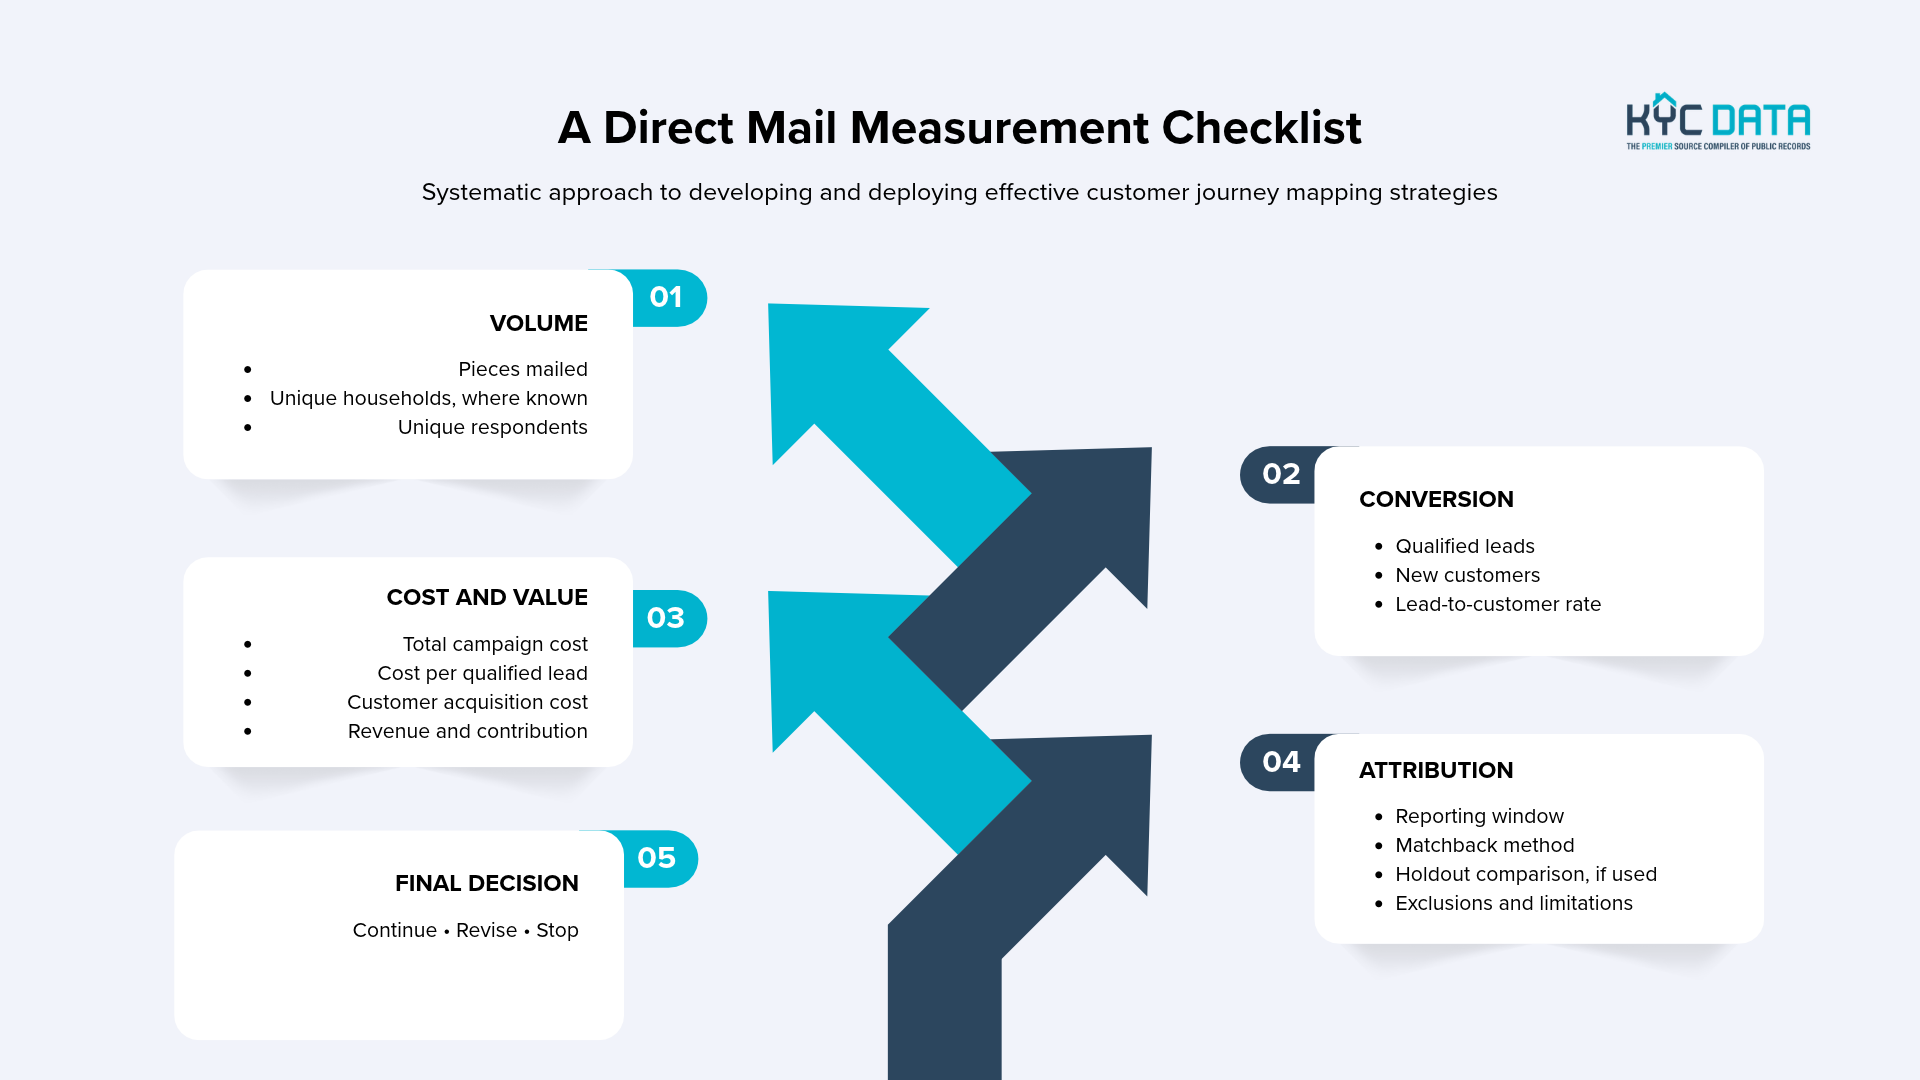
Include:
- Pieces mailed and unique households, where known
- Unique responses and qualified leads
- New customers and customer acquisition cost
- Campaign costs, revenue, and contribution
- Reporting window, exclusions, and attribution method
- Returned mail and any known tracking limitations
For campaigns with multiple touches, use the same definitions throughout. The multi-touch direct mail campaign approach should be assessed across the planned sequence, not just the first response window. State whether costs cover one drop or the full sequence.
End with a decision: continue, revise, or stop. Continue when outcomes meet the agreed commercial criteria. Revise when the data points to a specific question worth testing. Stop when results do not justify further spending. Keep uncertainty visible rather than allowing one attractive metric to decide the campaign.
Conclusion
Measuring a campaign means following results beyond response rate. Define the denominator for every metric, track qualified leads and customers, include campaign costs, and distinguish revenue from contribution. Use matchback to identify purchases linked to mailed records, but do not treat those purchases as automatically incremental. A holdout can provide additional context when designed carefully.
Before planning your next campaign, request a free data sample from KYC Data and inspect the available fields. The form states that the data is intended for consumer direct marketing and does not include phone numbers or email addresses. Check that the inputs suit your intended audience before building your measurement plan.